Market Opportunity Assessment: A Founder's Guide
How to assess whether a market is real with TAM/SAM/SOM, jobs-to-be-done, and live demand signal, beyond deck theatre.
 Alessio Persico Founder of EchoSift



You have five ideas in a notebook. Three of them feel exciting on a Sunday afternoon. One has a friend asking when it’ll ship. None of them has a customer.
Market opportunity assessment is how you decide which of the five, if any, is worth two thousand hours of your life. Not whether the idea sounds smart in your head, but whether enough people, with enough urgency, will pay enough money for a product shaped like the one you can actually build. That is a larger question than “how big is the market,” and the gap between the two is why a clean TAM slide and a dead company so often show up together. According to CB Insights’ research on the top reasons startups fail, poor product-market fit drives 43% of startup failures, with the analysis noting that “two-thirds of product-market fit failures were early-stage companies that never found a market.”
So this guide treats assessment as four passes, not one number: size the room, find the unmet job, pick where to play, then validate against live demand. The spine is Tony Ulwick’s opportunity algorithm, a way to score which jobs matter a lot and are served badly, because that is the pass that actually tells you whether anyone is unhappy enough to switch. Sizing is necessary but it is the pass that lies most easily, so it gets the least room here.
How this differs from our TAM/SAM/SOM guide
Sizing is one of four passes in this piece, and we keep it deliberately short. This guide is about the other three passes, the ones that decide whether a well-sized market is actually worth entering.
The full mechanical method, counting distinct owners bottom-up to build TAM, SAM, and SOM with a worked example, lives in how to calculate TAM, SAM, and SOM.
Table of Contents
- Founder’s First Hard Question: Is This Market Real?
- What “Market Opportunity” Actually Means
- TAM, SAM, SOM: The Sizing Pass
- Jobs-to-Be-Done: What Sizing Misses
- Where to Play: Picking the Right Segment
- Validation: The Step Most Founders Skip
- Putting It Together: A Four-Step Pipeline
Founder’s First Hard Question: Is This Market Real?
Founders usually feel a market opportunity before they can articulate it. You see a pattern in the questions friends ask, the workarounds your team builds, the threads that keep showing up in the same subreddits. That instinct matters. Most successful products started as pattern recognition before they became a deck.
But instinct alone is also how founders end up at month 14 of building something nobody wants. The pattern in your head needs evidence before you spend 2,000 hours on it. That’s the job of market opportunity assessment: convert a pattern into a decision-grade artifact.
Where the instinct stops being enough
If you cannot describe your market opportunity in one sentence that a stranger could repeat without confusion, you have a hunch, not an opportunity.
The rest of this guide walks through the four lenses that turn the hunch into an artifact: sizing, jobs-to-be-done, segment choice, and validation.
What “Market Opportunity” Actually Means
The term gets used loosely. Three definitions live underneath it, and they’re not interchangeable.
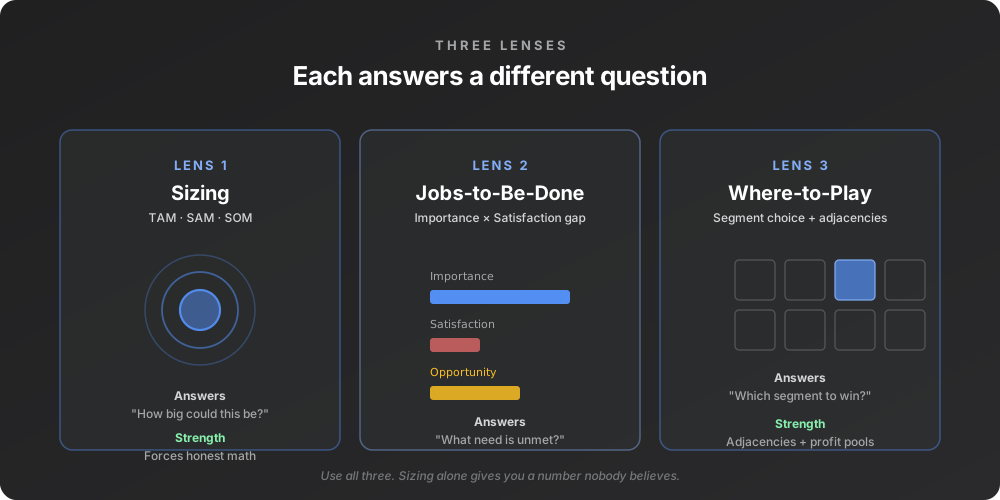
- Sizing definition. Market opportunity = the total revenue available if a product shaped like yours captured every plausible buyer. This is the deck-friendly version.
- Jobs definition. Market opportunity = the gap between how important a customer’s job is and how well current solutions satisfy it. This is the version that produces actual product decisions.
- Strategic definition. Market opportunity = the specific segment where your shape of company can win against current alternatives. This is the version that turns sizing math into go-to-market.
A serious assessment uses all three. Pick only the first and you get a number nobody believes. Pick only the second and you get a beautiful product nobody can find. Pick only the third and you compete head-on with players who have more capital than you.
The inverted approach most founders take
The mistake I see most often is choosing the model before choosing the opportunity. The founder decides she wants to build “a B2B SaaS” or “a dev tools company” and then hunts for an opportunity that fits the chosen shape. The model is the goal; the market is the rationalization.
Strong businesses usually form in the opposite direction. A specific frustration appears first. A friend complains about something for the fifth time, a forum thread keeps reappearing, a workflow keeps breaking. The product shape comes later, after the founder has stared at the frustration long enough to see what it actually wants. (This is why our guide on how to find startup ideas starts with observed pain rather than brainstorming a business model.)
| Where the assessment starts | What it turns into | Can it rule the idea out |
|---|---|---|
| The model first, "I want to build a B2B SaaS" | ✗ An exercise in confirmation bias: you find the data that supports the model you already chose | ✗ No |
| The pain first, a frustration that keeps reappearing | ✓ A diagnostic you can run against evidence | ✓ Yes, which is the whole point |
TAM, SAM, SOM: The Sizing Pass
The first pass answers one question: if you captured a fair share of this market, could it pay for the company you want? Three nested numbers frame it.
| Number | What it counts | Usually in the deck |
|---|---|---|
| TAM | Everyone with the problem | ✓ Yes, on its own slide |
| SAM | The slice a company shaped like yours could actually serve | ✗ Often missing |
| SOM | The part you can realistically win in the first few years | ✗ Often missing |
A deck that shows only TAM is hiding the two numbers that decide whether the business survives.
The only rule that matters at this stage is direction. Build the numbers bottom-up from a unit count you can defend, never top-down from a slice of some analyst’s total. For a developer tool the honest unit is a distinct owner, one independent person, team, or repository that has shown the problem in public. Count those and the dollars follow, because dollars are just price times demanders. The price half of that multiplication deserves its own pass before the sizing spreadsheet hardens, since guessing ARPU quietly decides the outcome: how to price a developer tool covers where that number should come from. Start from a big report and you are reverse-engineering the answer you already wanted.
That is the whole sizing discipline in two paragraphs, which is deliberate. The mechanics, the worked CI-reliability example, the top-down failure mode, the venture-fundable thresholds, and the volume-versus-owners inflation trap that quietly wrecks most sizing, are laid out step by step in how to calculate TAM, SAM, and SOM. Run that method to get your numbers, then come back, because sizing has one blind spot the next pass exists to fix: a big room tells you nothing about whether anyone in it is hungry.
Jobs-to-Be-Done: What Sizing Misses
Sizing tells you how big the room could be. It tells you nothing about whether anyone in the room is hungry.
That’s where jobs-to-be-done comes in. The framework, developed and popularized in Strategyn’s outcome-driven innovation work by Tony Ulwick, reframes the question. Instead of “how big is the market,” ask “what job is the customer trying to get done, and how badly are current solutions failing them?”
A job is not a feature, not a product category, and not a demographic. It’s a specific outcome a customer is trying to achieve in a specific context. “Reduce the time to debug a flaky CI pipeline” is a job. “DevOps engineers” is a demographic. The job is the unit that matters, because customers don’t buy demographics. They hire products to do jobs.
The opportunity algorithm
Ulwick’s contribution is a deceptively simple equation that turns the framework into a measurable lens:
Opportunity = Importance + max(0, Importance − Satisfaction)Read it as: for each step in a customer’s job, score how important it is (1-10) and how well current solutions satisfy it (1-10). When importance is high and satisfaction is low, opportunity is large. When importance is high and satisfaction is also high, there’s no room, because the job is already well-served.
This is the single most useful diagnostic I know for an early-stage opportunity. You can run it in an afternoon with 10 user interviews. You don’t need market research firms or industry reports. You need to ask people what they’re trying to do and how well today’s tools help them do it.
A big room is not a hungry room
Sizing tells you the market is big. The opportunity algorithm tells you whether anyone is actually unhappy enough to switch. Both are required.
Where to Play: Picking the Right Segment
Sizing and JTBD together describe a need. They don’t tell you where to attack from. That’s the question McKinsey’s growth research frames as “where to play”: which slice of the market to enter, given your capabilities and current competitive dynamics.
Answering it means cutting the market into groups that behave differently, not groups that share a job title. The practical cuts for a dev-tool buyer, by stack, team size, and who actually holds the budget, are covered in how to segment a developer audience.
The “where to play” lens forces three uncomfortable questions:
- Where is the profit pool? Some segments are huge but unprofitable (commodity infrastructure, race-to-zero pricing). Some are small but rich (specialized vertical SaaS with low churn). Sizing alone doesn’t tell you which is which, and the tells that a segment has already been competed flat are catalogued in signs of a saturated market.
- Where are the adjacencies? A startup that wins one narrow segment can expand into adjacent ones over time. Picking a wedge that has expansion paths beats picking the biggest segment with no adjacency.
- Where are the structural trends? Markets shift. Solving today’s biggest problem when the underlying technology is changing means you build a product that’s obsolete on arrival.
For a founder, this lens is what turns sizing from a static spreadsheet into a go-to-market choice. The concrete form of that choice is a gap you can name in the tools your buyer already pays for, which is the exercise in competitor gap analysis.
| Wedge | Profit pool | Adjacency and trend | Read |
|---|---|---|---|
| 5% of a $1B market | ✓ Specialised, low churn | ✓ A clear expansion path and a tailwind | ✓ Usually the better bet |
| 1% of a $100B market | ✗ Commodity, race to zero | ✗ Nothing to expand into | ✗ A large number with nowhere to go |
Validation: The Step Most Founders Skip
Sizing, jobs, and segment choice can all be done at a desk. They produce a story. Validation produces evidence. If you want a deeper playbook for this stage, our guide on how to validate a SaaS idea walks through the interviews, landing-page tests, and behavioral signals that turn a desk assessment into confirmed demand.
The gap between story and evidence is where most market opportunity assessments collapse. The numbers add up, the narrative sounds clean, but no one has ever paid a dollar for the thing. CB Insights’ analysis notes the same pattern: the failure mode isn’t usually “we built the wrong thing.” It’s “we never confirmed anyone wanted the thing we built.”
Validation has two flavors and both matter.
- Conversational validation. Talk to 10-30 prospective buyers. Not to sell, but to understand. What job are they trying to get done, what do they currently use, what breaks. Tactic from the JTBD playbook: never ask “would you buy this,” ask “tell me about the last time you tried to do X.”
- Behavioral validation. Get someone to do something costly that signals real intent. Pay a deposit. Sign a letter of intent. Use a prototype daily for a week and beg for the next version. Stated preference is cheap; revealed preference is signal. Which tests to run, and what counts as a passing result for each, are set out in how to measure demand for a SaaS idea.
From static assessment to live signal
There’s a third validation layer that most founders ignore because the tooling didn’t exist a few years ago: live signal monitoring of public complaints, feature requests, and workarounds across developer communities, support forums, and issue trackers.
The advantage of live signal over the first two layers is that it’s always on. Conversational validation runs out the day you stop scheduling calls. Behavioral validation gives you a snapshot per cohort. But the pain that drives a market is constantly being expressed by real people in public, on GitHub, Stack Overflow, Hacker News, Reddit, product changelogs, and support communities. That signal exists whether you watch it or not.
A founder who builds the habit of watching that signal stops needing to guess. The market tells you what it wants, in its own words, at the cadence it’s actually moving.
To make that concrete: here is the pain cluster “Inefficient CI/CD Processes” as of the 2026-07-31 snapshot in our own signal index, read across public dev communities.
That is exactly the shape of demand evidence a static TAM slide cannot give you, since 35 named owners actively hitting the same wall is a far stronger validation input than any top-down estimate of how many developers exist.
The churn between snapshots makes the same argument a second way. The cluster this section cited on 2026-07-04, “MCP Tools Not Functioning as Expected” at 75 mentions from 25 distinct owners, has since dropped out of the top-ranked set entirely, while the index as a whole now holds 35,108 tracked signals, 3,240 of them new in the last 7 days across 4 sources. A ranking that reshuffles inside four weeks is telling you something a Q1 assessment cannot: which of those two problems is worth building against today.

Practical rule: an opportunity assessment that ends with sizing is a deck. An assessment that ends with weekly signal monitoring is a habit. The habit is what compounds.
Putting It Together: A Four-Step Pipeline
If I were running a market opportunity assessment from scratch for a new idea, I’d run it in four passes, in this order:
Size the room, one week
Build TAM/SAM/SOM bottom-up and defend the unit count and ARPU out loud. If the math does not support a credible SOM at year 3, stop here, because the rest does not matter.
Map the jobs, one week
Pick the top 3 jobs your buyer is trying to get done, score importance and current satisfaction for each step, and keep the 1-2 highest opportunity scores. If nothing clears the threshold, the market may exist but the urgency does not.
Pick the wedge, one week
From the top opportunity scores, choose the segment to enter first: profit pool, adjacencies, tailwinds. Win narrowly before expanding.
Validate, ongoing
Interview 10-30 people in the chosen segment, capture behavioral signals, and set up live monitoring on the public surfaces where your buyers complain.
Three weeks plus an ongoing habit. That’s the assessment. Skipping any of the four passes is what produces the slides that look beautiful and the failures that look identical.
The founders who skip pass 4 are the ones most surprised when the market they assessed in Q1 looks different by Q3. Markets move. Static assessments don’t. The fix is to build a feedback loop that tells you when your assumptions break.
If you’re a developer-tool or dev-adjacent founder running this assessment, the live-signal layer is exactly what EchoSift was built to make easier. We surface clustered pain signals across GitHub, Stack Overflow, Hacker News, and other public dev communities, then translate them into searchable patterns so the validation layer of your assessment doesn’t depend on whether you happened to be reading the right thread on the right day.
Assessment is four passes: size the room, score the jobs, pick the wedge, then validate against live demand. The first pass is arithmetic you run once. The last is a habit you keep. EchoSift is built for that last pass. It clusters public complaints into named pain signals, scores them by growth and volume, and lets you query by macro area, so the question that actually decides this guide, is anyone still hungry enough to switch, gets a live answer instead of a quarterly guess.
This guide was drafted with AI assistance and reviewed by the EchoSift team. Signal figures reflect our live index as of the date noted and will shift as new mentions arrive.