SaaS Pricing Models: How to Choose Yours Before You Have Customers
Flat rate, per seat, usage based, tiered and hybrid compared on what each fits and what breaks it, plus how the volume-to-owner ratio in demand data picks your pricing model.
 Alessio Persico Founder of EchoSift



Five models cover almost every SaaS: flat rate, per seat, usage based, tiered and hybrid. Guides explaining what each one is are everywhere. What they rarely say is how to choose the one your particular market will carry, so founders fall back on looking sideways: find three competitors, take a number in the middle, add a dollar sign, ship. That number carries no information about the people who will pay it, and if the competitor guessed wrong, you have inherited the mistake.
There is a better input, and it is available before you have a single customer to test on. Demand has a shape. A problem carried by 143 separate teams, each raising it once or twice, is a different commercial object from one where 59 complaints trace back to 6 owners. The first shape will carry a low flat price and win on reach. The second will carry usage based or premium pricing, because the few who have it are drowning in it.
The five SaaS pricing models compared
Each row is a judgment about fit rather than a ranking. The middle column is the one that decides your choice, and the right-hand column is what you will be living with if you choose wrong.
| Pricing model | Fits when | What breaks it |
|---|---|---|
| Flat rate | Demand is broad and shallow: many buyers, modest pain each | One price serves the solo developer and the platform team badly |
| Per seat | Value grows with headcount and teams adopt together | It charges the customer for inviting colleagues |
| Usage based | Pain is concentrated: few buyers, each feeling it acutely | Unpredictable bills that a finance team cannot forecast |
| Tiered | Buyers fall into groups you can name without inventing them | Packages that split your feature list rather than your market |
| Hybrid | A stable base plus a variable part that genuinely scales | Two dials to explain, and it can hide a weak value metric |
Developer tools are the hard case for all five. The buyer is technical and can often build a weekend version of your feature, which caps what they will pay. Substitutes are frequently free, because open source sets a floor of zero across whole categories. And the value is diffuse: a tool that saves ten minutes a day is real but awkward to invoice for. Choosing the wrong model in that environment does not cost you a few percent, it can cost you the ability to charge at all.
Now look at what the middle column has in common. Every condition in it describes buyers, not features: how many there are, whether they arrive in teams, how hard the problem bites each one. The model you pick is therefore a claim about the structure of demand, and that structure can be measured in public before anyone has given you money.
What the shape of demand tells you
What matters here is reach across people rather than sheer noise: how many distinct, independent parties carry the problem. In EchoSift’s terms that is the owner count: the number of separate repositories, askers or accounts behind a cluster of complaints, as opposed to the raw mention volume. Volume tells you how much a topic is discussed. Owners tell you how many independent buyers exist.
Read against today’s feed, the contrast is stark. “Improve Project Documentation for Onboarding” carries a volume of 263 spread across 143 distinct owners, which is under two mentions per owner. “Configuration and Discovery Challenges with MCP Servers” shows the same shape at smaller scale: volume 44 across 30 owners. Both are broad and shallow, many separate people each holding a modest version of one problem. That is the flat rate and per seat shape, because no single buyer feels enough pain to pay a premium and there are a great many of them.
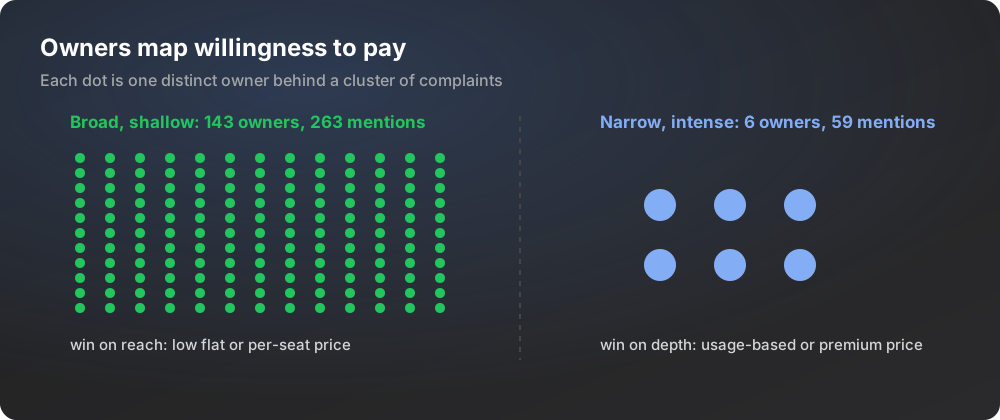
The other shape sits a few rows down the same feed. “High severity vulnerabilities in Express framework” runs at volume 59 from only 6 owners, close to ten mentions each. Six teams generating that much traffic about one thing are stuck, not chatting. That is where usage based or premium pricing earns its keep, because the invoice can scale with how much of the problem you remove.
Turning the ratio into a model
Divide mentions by owners and you have the number that picks the row. A low ratio means distributed demand: lots of people, low intensity per person, so price flat or per seat and compete on how many of them you reach. A high ratio means concentrated demand: few people, high intensity, so charge for depth and let consumption carry the bill. The awkward middle, roughly two to four mentions per owner, is where tiered and hybrid live, because the population genuinely splits into a casual group and an intense one. “UI layout and responsiveness issues” sits there at volume 104 across 37 owners.
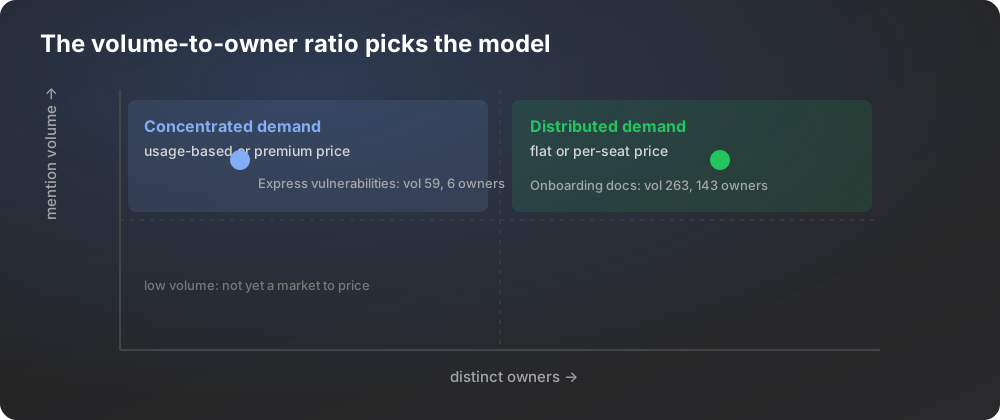
The ratio also stops an inflated market size from setting your price. A cluster with big volume and almost no owners is a conversation, not a customer base, and it will support no price at all. That is the same discipline behind defensible market sizing, which is why the owner-based method in how to calculate TAM, SAM, and SOM doubles as a pricing input: count the independent buyers first, then decide what one of them is worth. The same count feeds straight into SaaS unit economics, where price meets the cost of serving it.
Where this reading stops
It would be convenient to claim that demand data produces a price. It does not, and pretending otherwise would make this another vendor pitch rather than a method you can use.
What the shape will not do
It will not give you a number. The reading tells you which model the demand supports and roughly how much room sits above the free floor, and there it ends. The figure itself still comes from putting a price in front of buyers and watching who walks away. It is also blind wherever the complaint stream is thin: an internal enterprise workflow leaves almost no public trace, so a low owner count there tells you nothing except that you are looking in the wrong place.
Growth tells you which way the price can move
A snapshot tells you how big a problem is today. The growth ratio tells you whether your pricing power is rising or falling. “Sandbox Issues in Codex CLI Versions” carries a growth ratio of 1, a doubling on a small base of 9 owners, which is the profile that supports raising prices as the tool matures. “Insecure JWT Secret Handling” runs the other way at -0.86, from 7 mentions in the previous window down to 1. Both problems are real. Only one of them is getting more expensive to have.
Growth also interacts with the free-substitute floor. Developer categories are governed by price elasticity of demand: when a good-enough open-source option exists, demand is highly elastic and a small increase pushes buyers to the free tool. The mechanism you are trading against is value-based pricing, where price is set against the buyer’s perceived worth of the outcome rather than your cost to deliver it. That worth is exactly what a rising, unabsorbed problem inflates. This is also why validating a problem and pricing it are one job rather than two: the evidence in validating a SaaS idea that proves demand exists is the evidence that sets its ceiling.
Pick a value metric, then anchor it
The model tells you how to charge. The value metric tells you what to count: seats, API calls, monitored repositories, resolved signals, gigabytes. A good metric grows with the customer’s success, is easy for them to predict, and is hard to game. Seats are simple but punish teams for adding people. Pure usage can produce alarming bills. The craft is picking a unit the buyer already believes tracks their value, which is another reason to read their complaints closely: the unit they keep counting in their own words is usually the unit they will accept on an invoice. Stripe’s overview of SaaS pricing models maps the common structures and where each tends to leak.
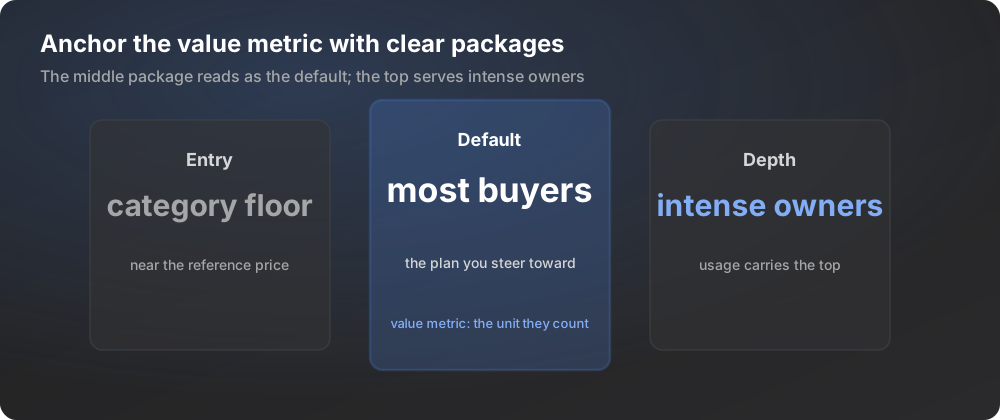
With a metric chosen, anchor it. Buyers judge price by comparison, so the first number they see frames every number after it. Offer a small number of clear packages rather than one take-it-or-leave-it price, and put the plan you expect most people to buy in the middle so it reads as the default. Where demand is broad and shallow, that middle plan sits near the category floor and the packages exist mainly to make the choice fast. Where demand is concentrated, the top package carries the usage and the middle one exists to make the top look reasonable.
The mistakes that quietly cap revenue
Four ways founders cap their own revenue
Pricing off volume instead of owners, which over-invests in loud ownerless topics nobody buys. Charging flat for concentrated, high-intensity demand, which leaves on the table the money the most desperate buyers would happily pay. Assuming today's price is tomorrow's, when pricing power tracks growth and a shrinking problem sustains no premium however good the tool. And ignoring the free-substitute floor, which is why so many genuinely useful developer tools still cannot charge: a weekend clone caps the category.
Underneath all four sits the same correction. The model is a reading of demand structure rather than a number you invent: owner count maps how many independent buyers exist, the volume-to-owner ratio picks the row, and growth says which direction your ceiling is moving. Do that reading before you build, revisit it as the signals move, and the number at the end becomes a decision you can defend and update. Cost belongs in the same conversation, because a price is only viable if it clears burn rate and pays back your customer acquisition cost inside a timeframe the runway can absorb, and market opportunity assessment tells you how much room you have to get it wrong before correcting.
Reading owner counts, volume-to-owner ratios and growth by hand across tens of thousands of clusters is the slow part. EchoSift does that reading continuously, so the shape of demand behind a problem is visible before you commit to a model.
This article was drafted with AI assistance and reviewed against EchoSift’s proprietary signal data before publishing.