Signs of a Saturated Market: What It Is and How to Read Demand
A saturated market is one whose demand is already met by existing supply. Spot one from flat growth on high-volume problems, mentions with no distinct owners, and table-stakes requests.
 Alessio Persico Founder of EchoSift



How do you tell a market worth entering from one that has already been claimed? The surface data looks identical: loud complaints, high search volume, thousands of people discussing the same pain. The difference sits underneath: in a saturated market, the people who have the problem have mostly found something that solves it, and the ones who have not are being fought over by every incumbent at once.
Founders confuse the noise for opportunity
Thousands of people talking about a problem reads like a green light. The same data, one layer deeper, is a red one.
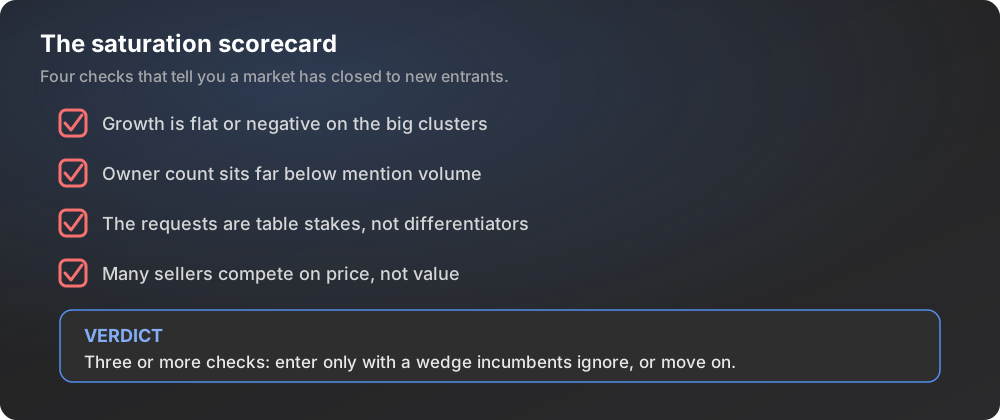
A saturated market is a market whose demand has already been absorbed by the products serving it: almost everyone who has the problem has bought, adopted, or settled for something that handles it, so a new sale has to be taken from a competitor rather than found among people entering the category for the first time. In practice it shows up as four readable conditions: high awareness paired with flat or falling growth, many sellers whose offers differ mainly on price, feature requests that every established product already satisfies, and mention volume that traces back to far fewer independent buyers than the raw count suggests. Saturation is always measured against a specific problem at a specific moment, which is why a category can be closed at its headline level while a narrow segment inside it stays wide open.
The trap is that saturation and opportunity look identical from a distance. Both show high mention volume. The difference is in the shape of the demand underneath: whether it is still growing, whether it comes from many independent people or a few loud ones, and whether the thing being asked for is already table stakes across the category. This piece is a way to tell the two apart before you spend a year building, using the same public complaint streams that would otherwise fool you.
What “saturated” actually means
That definition carries a hard economic edge. Once a category’s demand has been largely absorbed by existing supply, competition stops being about who has the problem and becomes about price, brand, and switching cost. This is the world Michael Porter described in his account of how competitive forces shape strategy: when rivalry is high and the threat of substitutes is real, margins compress and a new entrant with no distribution has almost nothing to trade on.
For a developer tool that matters more than usual, because the buyers are technical, the substitutes are often free, and a “good enough” open-source project can cap the whole category’s willingness to pay. The most expensive mistake here has nothing to do with picking a bad problem. It comes from picking a real, popular, well-understood problem that a dozen people have already solved. CB Insights’ long-running teardown of why startups fail puts “no market need” at the top of the list, but a close cousin, entering a market where the need is already served, fails just as quietly. Reading saturation early is how you avoid both.
Sign 1: high volume, flat or falling growth
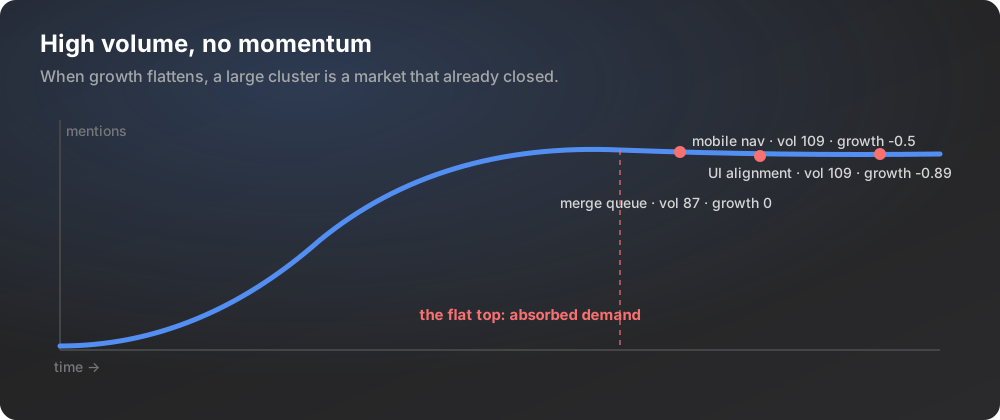
The clearest tell is a problem that lots of people mention but that is no longer growing. EchoSift’s current snapshot, taken on 5 August 2026 across 37,277 tracked signals from 4 sources with 2,751 new signals in the last seven days, puts four clusters side by side.
| Cluster on the 5 August 2026 feed | Volume | Owners | Mentions prev to last | Growth ratio |
|---|---|---|---|---|
| Mobile Navigation Issues and Usability Challenges | 109 | 48 | 2 to 1 | ✗ -0.5 |
| UI Alignment and Responsiveness Issues | 109 | 40 | 9 to 1 | ✗ -0.89 |
| Merge Queue Fails to Enforce Checks | 87 | 60 | 17 to 17 | ~ 0 |
| Inconsistent CI/CD Processes and Failures | 132 | 85 | 31 to 72 | ✓ +1.32 |
“Mobile Navigation Issues and Usability Challenges” is one of the largest clusters by raw size and scores 83.8, so it looks like a huge opportunity until you read the trailing window. The problem is real and widespread, and the conversation around it is draining away, because the frameworks and component libraries developers already use keep absorbing it. Building a standalone product for a well-known problem that incumbents are steadily closing is entering at the top of the curve, right as it rolls over.
High presence, no momentum: that is the shape of the first three rows. The fourth is the biggest cluster in the same snapshot and scores 112.3, and it is still climbing. Same feed, same week: one set of problems has stopped moving, another is still opening. Growth, not volume, is the signal that a problem still has room for a new entrant. Reading a plateau as a trend is also where a demand forecast goes wrong at the source, which is why the method in how to forecast SaaS revenue insists on a window long enough to show whether the curve is still rising.
The figures in this section moved a long way since the July version of this article, which led on an API rate-limiting cluster at volume 75 with 45 owners and a growth ratio of -0.8. That cluster does not appear in the current snapshot at all. The disappearance is the lesson rather than an inconvenience: a saturated problem does not stay loud while it dies, it stops being discussed, so the examples rotate faster than the pattern does.
Sign 2: loud mentions, missing owners
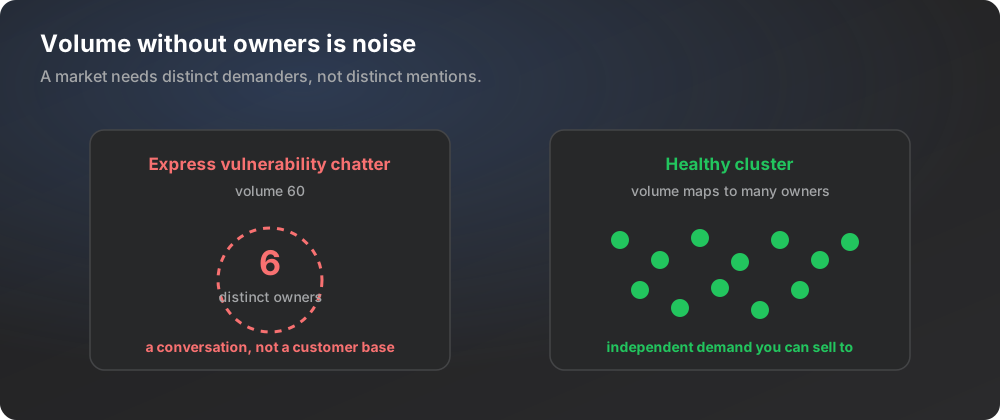
The second tell is a cluster with high volume and almost no distinct owners behind it. This is commoditized noise pretending to be demand. In the current snapshot, “High severity vulnerabilities in Express framework” reads as a serious, active problem until you put its four numbers next to each other.
Sixty mentions from six independent sources is a pile-on around a handful of advisories, not sixty people each carrying the problem into a purchase decision. The July version of this article made the same point with a CVE cluster at volume 23 and 0 owners. That cluster rotated out within weeks; the shape it illustrated, volume running far ahead of the people behind it, kept showing up in whatever replaced it.
The extreme version is still there too. “Frustrating Government Interactions” scores 73.9 on a volume of 6 with 0 distinct owners, a topic the scoring model reads as active while nobody identifiable stands behind it. There is no coherent buyer to sell to, only a subject that trends.
A market needs distinct demanders, not distinct mentions. When volume is high and the owner count collapses toward zero, you are looking at a conversation, not a customer base. It is the same discipline that keeps market sizing honest, which is why the owner-count method in how to calculate TAM, SAM, and SOM is the antidote here: count independent owners, and a saturated or fictional market gives itself away because the owners are not there. A cluster you cannot map to distinct people is a cluster you cannot build a business on, no matter how much it is discussed.
Sign 3: the requests are all table stakes
The third tell is when the demand you find is for features every serious competitor already ships. These are not opportunities, they are the price of admission. In the current snapshot, “Improving Documentation for Onboarding” sits at volume 40 with 29 distinct owners, a score of 70.2, and a growth ratio of -0.5. Twenty-nine independent owners asking for better onboarding documentation sounds like validated demand, until you remember that essentially every mature tool in the category already claims to ship exactly that. Building a product whose headline value is a feature users expect for free is entering a red ocean where you compete on everything except the thing that would let you win.
Table-stakes demand is real demand, and that is exactly why it is dangerous.
Why table-stakes demand passes a naive check
People genuinely ask for it. The question saturation forces you to add is not "do people want this" but "does wanting this distinguish anyone."
When the answer is no, the request belongs in your product’s baseline, not its pitch. Separating a table-stakes request from a differentiating gap is the core move in a competitor gap analysis: you are hunting for the pain incumbents have not closed, not the pain they closed years ago.
Sign 4: many sellers, thin differentiation
The last tell sits above the individual clusters. Count the number of viable products already serving the pain, and ask what any of them competes on besides price. When a category has many sellers offering near-identical value, Porter’s rivalry force is at its maximum and the category’s economics belong to whoever already has scale. A late entrant with no distribution advantage inherits the worst of it: high acquisition cost, low switching incentive, and a customer who has already normalized paying little or nothing. Push those two numbers through a model of your SaaS unit economics before committing, because in a saturated category acquisition cost rises and the price ceiling falls at the same time, and the payback period is where that squeeze becomes visible first. The presence of a strong free substitute is the single fastest way a developer-tools category saturates, because it sets the ceiling on what anyone will pay before you even arrive.
Reading saturation without walking away
Saturation is a reason to change your angle, not always a reason to quit.
The seam inside the crowd
A saturated headline market often hides an unsaturated seam inside it: a specific toolchain, a specific team size, a specific workflow where the incumbents' one-size solution fits badly.
The mobile navigation cluster is fading as a general problem, but a sharp version scoped to one runtime or one framework can still be wide open. Where a free incumbent sets the price ceiling, the wedge usually sits in what that incumbent declines to maintain, which is the search described in how to find product gaps in open source tools. The way through a crowded space is to enter on a wedge that the big players cannot be bothered to serve, which is the entire logic of Paul Graham’s advice to look for problems you have that few others have noticed yet rather than the obvious ones everyone is already chasing.
That reframing is where the underserved-niche work pays off. Once you can see which clusters are saturated, the same data points you at the adjacent ones that are not, which is how a disciplined founder turns a red-ocean map into a shortlist of defensible entries. Pair this reading with your tips for market research and a full market opportunity assessment, and saturation stops being a wall and becomes a filter, one that removes the crowded problems so the tractable ones stand out. Some of the best niche SaaS ideas are simply the unsaturated remainder of a market everyone else declared full.
What EchoSift automates
Doing this by hand means pulling complaints from GitHub, Stack Overflow, Hacker News, and Bluesky, clustering them into coherent problems, and then, for each one, tracking three things at once: whether the growth ratio is positive or fading, whether the mention volume maps to many distinct owners or a few loud accounts, and whether the request is a differentiator or table stakes. EchoSift computes and updates those numbers continuously, so instead of eyeballing whether a market is saturated you can read its growth trajectory, its owner count, and its source diversity per cluster directly, and priced around $39/month it replaces a week of manual triage with a live map. Saturation stops being a surprise you discover after launch and becomes a number you check before you commit.
This article was drafted with AI assistance and reviewed against EchoSift’s proprietary signal data before publishing.