How to Calculate TAM, SAM, and SOM Without Fooling Yourself
A bottom-up method for developer-tool founders to size TAM, SAM, and SOM by counting distinct owners in real pain signals instead of taking 1 percent of an industry report.
 Alessio Persico Founder of EchoSift



Every pitch deck has the slide: three nested circles, a big number with a lot of zeros at the top, and a hopeful arrow pointing down to a smaller one. TAM, SAM, SOM. Most founders build it backwards. They open an industry report that values the “developer tools market” at some vast figure, take 1 percent of it because 1 percent feels modest, and present the result as a plan. Any experienced reader discounts that number the instant it appears, because it was reverse-engineered from the answer the founder wanted rather than measured from demand that exists.
There is a better way to size a market, and for developer-tool and dev-facing SaaS founders it is unusually tractable, because the demand you want to count is written in public. This piece is a method for calculating TAM, SAM, and SOM from the bottom up, using distinct people who have the problem as the unit of measurement instead of borrowed dollar totals you cannot verify.
What TAM, SAM, and SOM actually measure
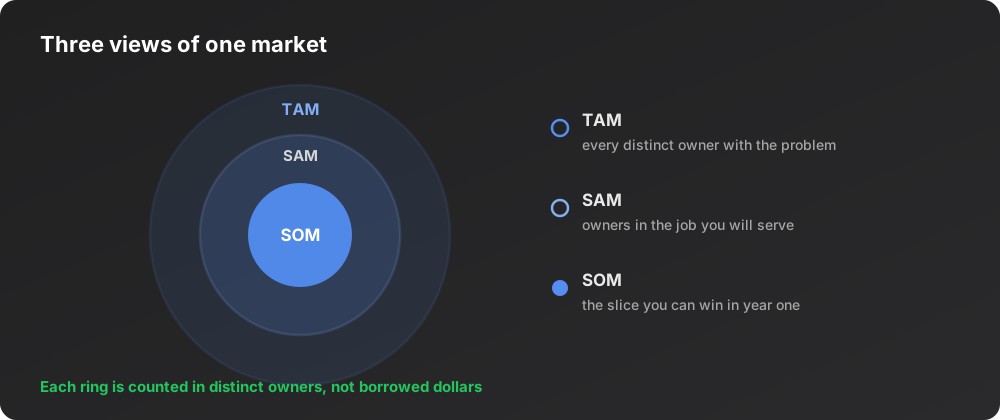
The three terms describe three shrinking views of the same opportunity. TAM, the total addressable market, is everyone who has the problem you solve, assuming you could reach all of them with no competition and no limits. SAM, the serviceable addressable market, is the slice of that total you could actually serve given your product, your channel, and your geography. SOM, the serviceable obtainable market, is the part of SAM you can realistically win in a defined window, usually the first year or two, given competitors and your own capacity. The total addressable market definition from Corporate Finance Institute frames TAM as the ceiling and their serviceable obtainable market definition frames SOM as the near-term floor you can defend.
The nesting matters because each number answers a different question.
| Number | What it counts | The question it answers |
|---|---|---|
| TAM | Everyone with the problem, assuming no competition and no limits | Is this worth anyone's time |
| SAM | The slice you could serve given your product, channel and geography | Is this worth ours |
| SOM | The part of SAM you can realistically win in the first year or two | What do we chase first |
A deck that only shows TAM is hiding the two numbers that determine whether the business survives.
Why the top-down number is fiction
The top-down method starts with a market total from an analyst and multiplies down. It fails for a structural reason: the total it starts from is an aggregate of things you do not sell, sized by a firm that never talked to your users. “One percent of a huge market” is not a forecast, it is a wish dressed as arithmetic. It also inverts causality. Real companies do not capture a fixed slice of a known pie. They start by owning a specific problem for a specific group, then expand outward, which is the entire logic of Paul Graham’s argument that a startup is a company designed to grow fast: you begin with something a small number of people want intensely and widen from there, rather than shaving a percentage off a giant abstraction.
The top-down number is seductive because it is easy and always large. The bottom-up number is harder and usually smaller, which is exactly why it is worth more. It forces you to name who has the problem, and naming them is the only way to later go find them.
Count demanders, not dollars
For a developer tool, the natural atomic unit of market size is a distinct owner: one independent person, team, or repository that has demonstrated the problem you solve. Dollars are a derived quantity, price times demanders, so if you can count demanders directly you have sized the market without guessing at willingness to pay first.
This is where public complaint streams become a measuring instrument. EchoSift clusters developer pain from GitHub, Stack Overflow, Hacker News, and Bluesky, and this is the snapshot of 11 July 2026 that the rest of the piece sizes against.
Each cluster carries not just a raw mention volume but a distinct-owner count, the number of independent repositories or accounts voicing it. That owner count is the closest thing to a real demand unit you can get without running a survey, and it is the number you should build TAM, SAM, and SOM on.
A worked example: sizing a CI reliability tool
Suppose you want to build a tool that makes continuous-integration pipelines reliable and legible for small teams. Instead of quoting the DevOps market’s dollar total, size it from the demand actually on record.
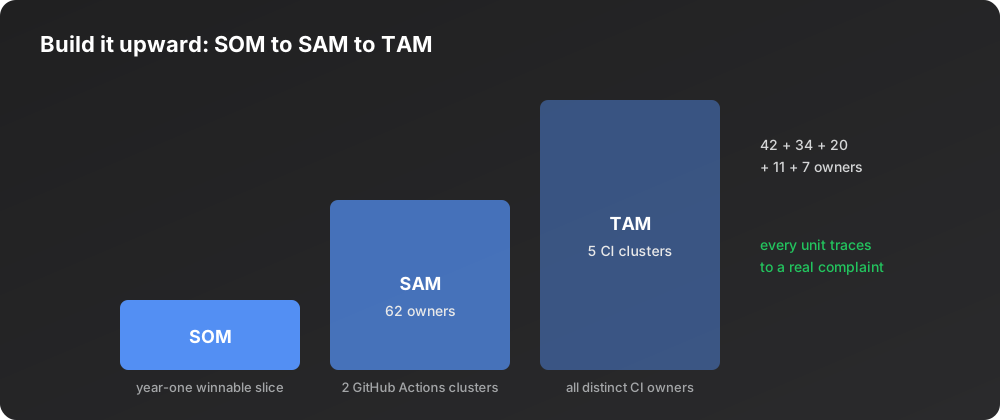
Start with TAM as the union of distinct owners hitting the broad problem, then narrow to SAM by deciding which of those owners your first product genuinely fits. Say you decide to serve GitHub Actions users on small teams first.
| CI cluster on the 11 July 2026 snapshot | Distinct owners | In the first SAM |
|---|---|---|
| Lack of Automated CI/CD Checks in GitHub Actions | 42 | ✓ Yes, this is the wedge |
| Issues with Pull Request Review Process | 34 | ✗ Later |
| Persistent CI/CD Pipeline Failures | 20 | ✓ Yes |
| Workflow Failures in Automated CI Processes | 11 | ✗ Later |
| Mismatch Between Local and CI Test Gates | 7 | ✗ Later |
Those clusters carry pain scores of 82.9 for the two CI/CD entries and 88.1 for the pull-request one, and the CI-checks cluster shows a volume of 65 behind its 42 owners, but the column that sizes the market is the owner count. De-duplicated across clusters, those owners are your addressable population for this snapshot: the people who have already shown the pain. Scaled across the full source firehose and the fraction of developers who never post, it becomes a TAM you can defend line by line, because every unit traces back to a real complaint. SAM is the segment your first product genuinely fits, not the segment you wish you could reach.
Finally SOM. Of the serviceable owners, how many can you realistically win in year one against incumbents and your own limited reach? A small team with no distribution should model SOM as a modest fraction of SAM, the owners you can find, contact, and convert through the specific channels you actually have. A tight, believable SOM built from named clusters beats a fantasy SOM extrapolated from a market total every time you have to defend it to a skeptical investor or, more importantly, to yourself.
The inflation trap: volume is not owners
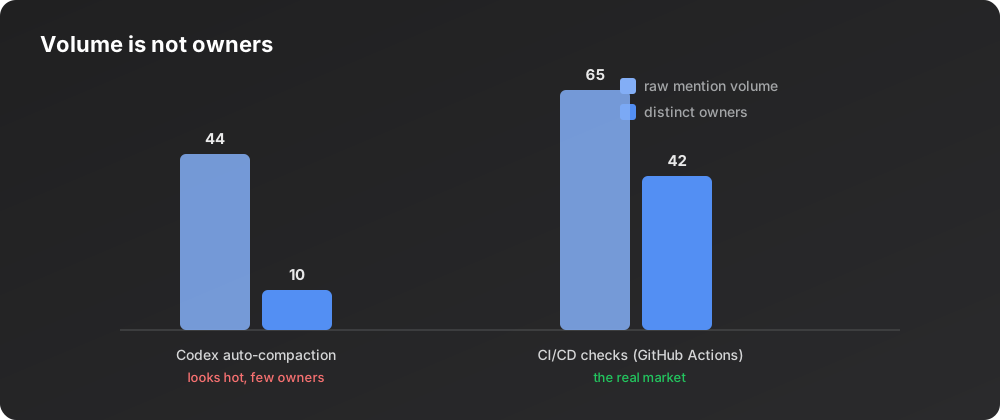
The single most common way founders inflate a market is to count mentions instead of demanders. A cluster can look enormous on raw volume while representing very few independent people. The snapshot makes this concrete. “Issues with Codex session auto-compaction” carries a volume of 44 and a blistering growth ratio of 6 with a score of 116, yet only 10 distinct owners stand behind it. Compare that to “Lack of Automated CI/CD Checks in GitHub Actions”, which has a volume of 65 but 42 owners. The first looks hot and is largely a handful of loud repositories churning the same complaint. The second is quieter per capita but represents four times the independent demand.
If you size a market on volume, you will chase the loud cluster and build for ten people who happened to file a lot of tickets. If you size it on owners, you build for the broad, quiet base that actually constitutes a market. Owner count is the deflator that keeps TAM, SAM, and SOM honest. This same discipline separates a real gap from a noisy one when you run a competitor gap analysis, and it is the backbone of any credible market opportunity assessment.
Turning three numbers into a decision
The point of sizing is the decision, not the slide. Once TAM, SAM, and SOM are built from owner counts, you can read them as a single question: is the serviceable, obtainable slice big enough to sustain the business you want, at the price you can charge? For a focused developer tool priced around $39/month, even a few thousand obtainable owners is a real company, and you now know exactly which clusters to go recruit them from. If the SOM you can defend is a rounding error, you learned that before writing a line of product code, which is the cheapest possible place to learn it.
This is also why sizing pairs with validation rather than replacing it. A number derived from complaints tells you the demand exists, not that people will pay. Run the sizing alongside the falsification work in how to validate a SaaS idea, and use the same signal data to scan for the niche SaaS ideas where a small, defensible SOM is actually attractive rather than a consolation prize. For the wider workflow, our tips for market research show how the same owner-count discipline threads through every stage.
What EchoSift automates
The manual version of this method is real work: pull complaints from four platforms, cluster them into coherent problems, de-duplicate the accounts and repositories behind each so you are counting owners and not mentions, and track how those counts move week over week so your TAM is current rather than a one-time guess. EchoSift does this continuously and hands you the owner counts, scores, growth ratios, and source diversity per cluster, so your market-sizing slide is built on a live measurement instead of a borrowed report.
This article was drafted with AI assistance and reviewed against EchoSift’s proprietary signal data before publishing.