Competitor Gap Analysis: Finding the Space Rivals Left Open
A developer-founder method for competitor gap analysis: map rival coverage against jobs to be done, read the public complaint stream for the job nobody serves, verify it with owner counts.
 Alessio Persico Founder of EchoSift



Picture the end of a competitor research session: you have a spreadsheet with six rivals down the side, fifteen features across the top, and a grid of colour-coded cells. The process felt thorough, yet the output tells you almost nothing you can act on. You listed the rivals, ticked the boxes they check, coloured the cells, and arrived at the same conclusion every founder arrives at: the market is crowded and everyone does roughly the same thing.
Where the feature grid fails
It answers the wrong question. A feature grid measures where competitors overlap, when the only thing worth money is where they all stop.
A useful competitor gap analysis inverts the exercise. Instead of cataloguing what rivals do, you hunt for the job their customers keep trying to get done that none of the products actually serve. That job is the gap. For developer-tool and dev-facing SaaS founders there is an unfair advantage hiding here, because the evidence for those unserved jobs is written in public, every day, in the complaints your future users file on GitHub, Stack Overflow, Hacker News, and Bluesky. This piece is a method for turning a crowded field into a specific, defensible opening.
Why the standard feature grid fails
The feature grid fails for a structural reason: it rewards parity and punishes insight. When you score competitors on the features they advertise, you converge on the features everyone already ships, because those are the ones with marketing pages. The grid is a map of the fought-over ground. It tells you where the trenches are, not where the flank is open.
Worse, a feature grid confuses activity with value. A rival can have forty features and still leave the one job that matters undone, badly, or buried three settings deep. Users do not adopt a product because it has more checkmarks. They adopt it because it finishes a job they were stuck on. The right unit of analysis is therefore not the feature but the job, which is the whole premise of the jobs-to-be-done framework: people hire a product to make progress in a situation, and they fire it when something makes that progress cheaper. Gap analysis done properly is a search for a job that customers are hiring nobody to do well.
That reframing changes what you look for. You stop asking “what features do we lack versus Rival B” and start asking “what is the job people keep failing to complete with any tool in this category, and can I see them failing at it in public.”
Map coverage against jobs, not features
List the real competitive set
Wider than the obvious named rivals: the adjacent tools people bend to fit, the internal scripts teams write to avoid buying anything, and the spreadsheet-and-duct-tape workaround that is often the true incumbent.
List the jobs across the top
The jobs a user in this category is trying to get done, phrased as outcomes rather than features.
Fill the grid with coverage
Score what each rival actually finishes, not what its marketing page advertises.
Look for the empty column
The one column where every cell stays blank.
The empty column is your candidate gap. This is the same instinct behind the strategy canvas in blue ocean strategy: plot how every competitor scores on the factors the industry competes on, and the interesting move is almost never to score higher on a crowded factor. It is to find the factor nobody is serving and make it your value curve. A crowded market and an open job are not contradictions. Markets get crowded on the easy jobs precisely because those are the ones everyone knows how to build, which leaves the hard jobs, the ones that are annoying to solve, quietly unserved.
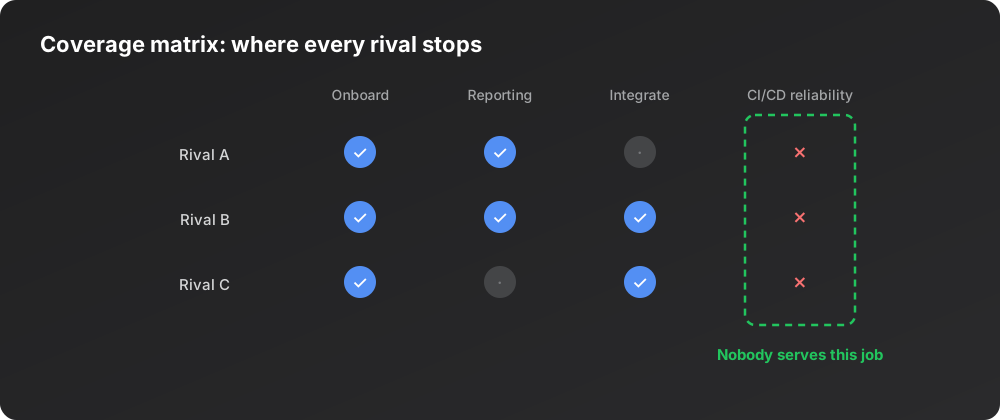
There is a discipline to naming the job well. If you phrase it as a feature (“a dark mode”, “a webhook”), you will find that some rival technically has it and conclude the gap is closed. If you phrase it as an outcome (“I need my CI to catch the failure before it reaches production, without wiring five actions together by hand”), you will find that nobody actually delivers the outcome even when several ship the parts. The gap lives in outcomes, not parts.
Read the complaint stream for the empty column
A coverage grid built from your own head is a hypothesis. The complaint stream is the test. If a job is genuinely unserved, the people trying to get it done are complaining about it in public right now, and the shape of those complaints tells you whether the gap is real and how wide it is.
Our own instrumentation makes the point concrete. This is what the EchoSift feed looked like on 10 July 2026, with the daily mention timeline climbing sharply into that window.
Inside that stream, one cluster stood out as a textbook coverage gap. “Lack of Automated CI/CD Checks in GitHub Actions” carried a pain score of 80.2 across a volume of 65 mentions, and it was raised by 42 distinct owners. Forty-two separate accounts, independently, describing the same missing outcome: their pipelines are not catching what they should before code ships.
Those forty-two independent voices are the signature of an open column: not one loud account with a niche grievance, but dozens of unrelated people hitting the same wall, which means the job is common and the existing tools, whatever their feature counts, are not finishing it. Two neighbouring clusters reinforce the pattern rather than dilute it. “Persistent CI/CD Pipeline Failures” scored 81.3 across 20 owners, and a request for a “Centralized Troubleshooting Guide” scored 75.1 across 20 owners. Different phrasings, same underlying job: developers cannot reliably tell why their pipeline broke and cannot fix it without a manual dig. When several independent clusters circle one outcome, the gap is not a fluke. It is a market.
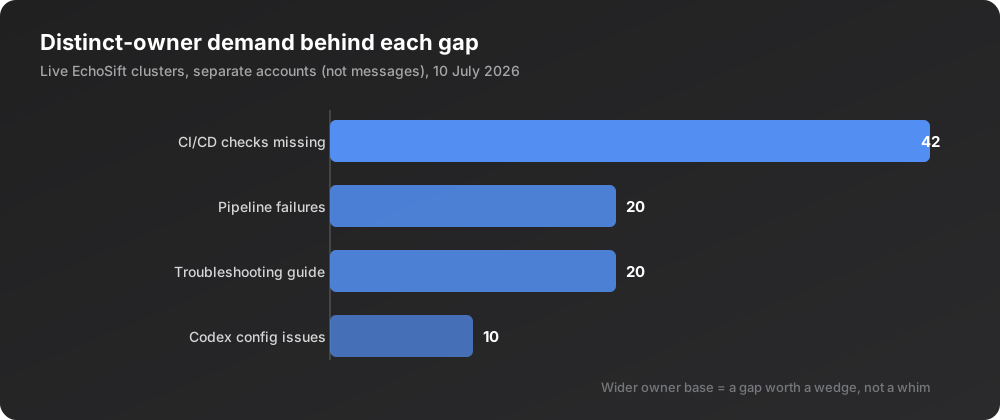
Contrast those with a thinner signal from the same feed. “Configuration and Connectivity Issues in Codex” logged a high volume of 83 mentions but only 10 distinct owners, which reads more like a small number of heavy users than a broad market. Volume alone would have ranked it near the top. Distinct-owner count moves it down, correctly. The lesson is the one we return to across every method: the number that survives scrutiny is how many separate people raise a complaint, not how loud any one of them gets.
Verify the gap with distinct-owner counts
The single most common way a gap analysis goes wrong is mistaking a vocal minority for a market. A cluster can look enormous by message volume and still trace back to three obsessed accounts posting forty times each. Build for that, and you build for three people. This is why distinct-owner count, the number of separate accounts behind a complaint, is the verification step that turns a candidate gap into a fundable one.
The rule of thumb is simple. Wide owner base and a coherent job equals a gap worth a wedge. Narrow owner base, even with high volume, equals a preference, not a pattern. On 10 July our feed put both shapes side by side.
| Cluster on the 10 July 2026 feed | Mentions | Distinct owners | Reads as |
|---|---|---|---|
| Lack of Automated CI/CD Checks in GitHub Actions | 65 | 42 | ✓ A gap worth a wedge |
| Configuration and Connectivity Issues in Codex | 83 | 10 | ✗ A preference, not a pattern |
The two neighbouring pipeline complaints sat between them at 20 distinct owners each. The owner column, not the volume column, is what tells you where to point a roadmap.
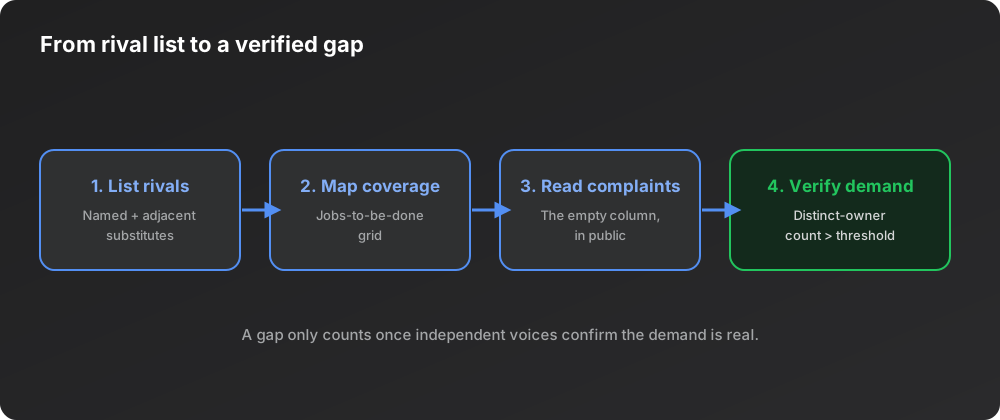
Verification also means setting a threshold before you look, so you cannot rationalise a weak gap into a strong one after the fact. Decide in advance what counts: how many distinct owners, sustained over how many weeks, before you treat a gap as real. If the complaint stream clears the bar, you have a competitive opening backed by independent evidence. If it does not, you have saved yourself from building into a hole that only looked like a market because a few people were loud. This is the same falsification discipline that runs through our wider tips for market research: a test only means something if you allowed it to return a no.
Turn the gap into a wedge, not a feature war
Finding the empty column is not the finish line. A gap is worth entering only if you can own it, and owning it usually means building the whole product around the unserved job rather than treating it as one more checkbox.
The trap on the far side
Filling the gap by bolting the missing feature onto a copy of everyone else's product drops you straight back into the feature war you were trying to escape.
The advantage of grounding the analysis in the complaint stream is that it carries into positioning. The exact language people use when they describe the unserved job is the language that will make your landing page land, because it is their words, not your marketing’s. When 42 owners keep saying their CI does not catch failures before production, “catch the failure before it ships” is a sharper promise than any feature list, and it is a promise the incumbents, busy defending their crowded columns, are structurally slow to make. Sizing that opening honestly is its own step, which is why gap analysis pairs naturally with a proper market opportunity assessment before you commit real time to it.
The short version
Competitor gap analysis is less a feature grid than a search for the job every rival’s customers keep failing to finish. Map coverage against jobs phrased as outcomes, not features, and find the column where every cell is empty. Then test that hypothesis against the public complaint stream, because a genuinely unserved job produces independent complaints you can read before you build. Verify the gap with distinct-owner counts, not raw volume, so you back a broad pattern rather than a loud few. On our feed on 10 July, 42 distinct owners describing missing CI/CD checks was a far stronger gap signal than an 83-mention cluster backed by only 10. Build the product around the job, use the owners’ own words as your positioning, and enter where the incumbents are structurally slow to follow.
Reading a live complaint stream for the job nobody serves, and counting the distinct owners behind it, is exactly the manual work EchoSift automates. It ingests developer complaints from GitHub, Stack Overflow, Hacker News, and Bluesky, clusters them into recurring pain patterns, and ranks them by how many separate accounts are behind each one, so the competitor gap is visible in the data before you commit to building.
This article was drafted with AI assistance and reviewed against EchoSift’s proprietary signal data before publishing.