How to Model SaaS Unit Economics
Model per-customer SaaS economics without flattering yourself: contribution margin, margin-adjusted LTV, the LTV to CAC ratio, and CAC payback in months when you have almost no data yet.
 Alessio Persico Founder of EchoSift



97 mentions of a single complaint, held by 52 distinct people, is a demand number. Divide the first by the second and you get 1.87 mentions per person, which is a different kind of number entirely: it describes the behaviour of one unit rather than the size of the pile. Both figures come from the same live EchoSift board, where “Complete redesign of user dashboard interface” carries a score of 90.6 on a volume of 97. Unit economics runs the same reduction on money. It takes the aggregates founders quote in decks, revenue, spend, headcount, and asks what happens when exactly one customer signs up, pays you for some number of months, and eventually stops.
That reduction is the whole discipline. Company-level cash questions belong to burn rate and runway, and the cost of winning a customer has its own estimation problem. This piece sits between them and covers the per-customer layer: contribution margin, how to compute lifetime value without lying to yourself, why the famous 3:1 ratio is so often misapplied, payback in months, and how to build a defensible model when your product has fourteen users and three months of history.
Choose the unit before you compute anything
The first decision has nothing to do with arithmetic. Decide what one unit is, and write it down. The billing event picks the unit for you.
| Billing model | The unit to model | What it changes |
|---|---|---|
| Per workspace | One paying workspace | The unit and the billing event are the same thing, so nothing has to be reconciled. |
| Per seat | One seat | An account with nine seats is nine units, and your churn maths changes shape. |
| Usage-metered API | One account | Usage varies so wildly that per-request economics tell you nothing about whether the business works. |
Getting this wrong quietly corrupts every downstream number. A team that models per account while billing per seat will overstate lifetime value on multi-seat accounts and understate acquisition cost, since the marketing spend that landed one logo gets divided by the wrong denominator. Pick the unit that matches the billing event, then hold it fixed across every metric in the model.
Contribution margin comes before lifetime value
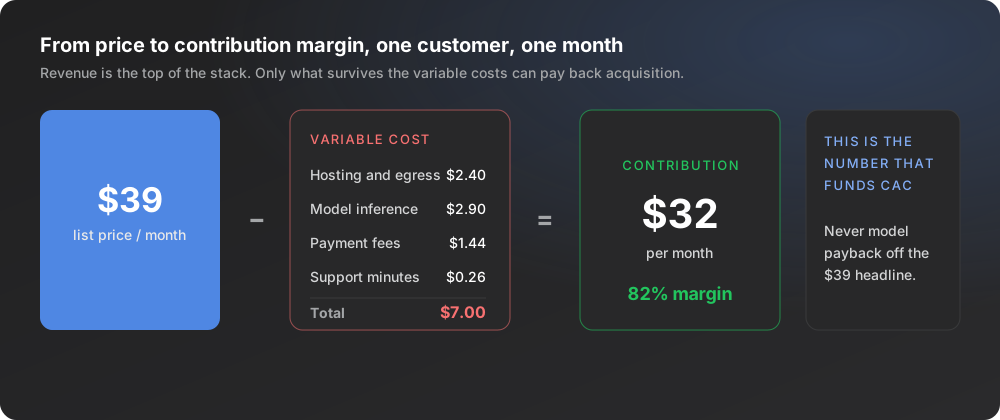
Take the price, then subtract everything that only exists because that specific customer exists. For a dev tool at $39 per month, that subtraction typically includes hosting and egress attributable to their workloads, model inference if the product calls an LLM, payment processing fees, and the support minutes their account consumes. Suppose those total $7.00 in a normal month. Contribution margin is $32, a gross margin of 82%, and $32 is the only money that can ever repay what you spent to acquire them.
Founders skip this step because early variable costs look trivial. They stop looking trivial the moment usage concentrates. Infrastructure pain is the loudest thing on EchoSift’s current board: “Frustrations with CI/CD and Deployment Reliability” holds a score of 94.2 across a volume of 52 mentions, and its recent mentions climbed from 5 to 16 in a single window for a growth ratio of 2.2. Underneath complaints like that sit real bills, and if your product is the thing running the pipeline, those bills are yours. The same applies to inference: “Model Inheritance and Switching Issues” appears with a volume of 23 in the AI and agents area, and every one of those switching decisions maps to a different cost per call in a product that resells model capacity.
Two rules keep the margin from drifting. Measure variable cost from an actual invoice line rather than an estimate, and recompute it per cohort, because the cost profile of a customer who joined during a free-form beta rarely matches the one who joined after you added rate limits.
Compute LTV so it can survive contact with reality
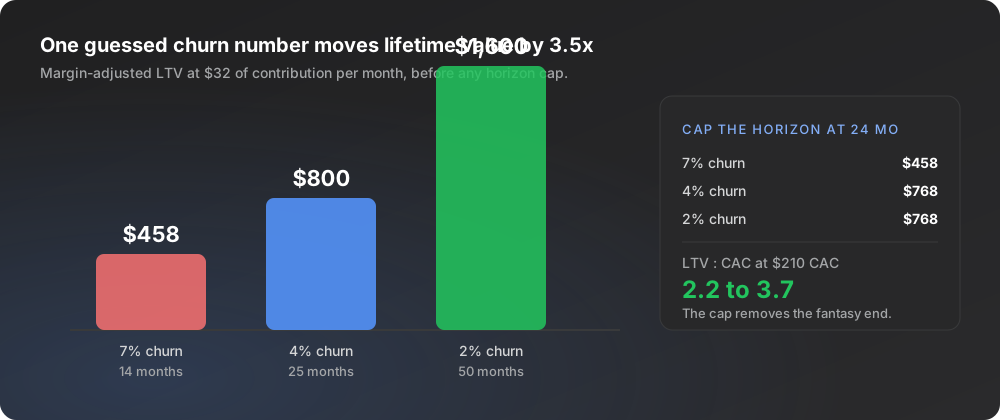
The textbook formula is monthly revenue per account, multiplied by gross margin, divided by monthly churn rate. Written the way you should use it: LTV equals monthly contribution margin divided by monthly churn. At $32 of contribution and 4% monthly churn, expected lifetime is 25 months and LTV is $800.
Look at where the fragility lives. Churn sits in the denominator, so the number you are least able to measure has the most leverage over the answer. At 7% monthly churn the same customer is worth $458. At 2% they are worth $1,600. Same product, same price, same cost structure, a 3.5x swing driven entirely by an assumption. Early-stage founders routinely plug in 2% because it appears in benchmark posts, then build a hiring plan on top of it.
Three habits make early LTV defensible.
Cap the horizon
Count no more than 24 months of contribution regardless of what the churn maths implies, which turns the 2% fantasy back into $768 and removes the most flattering end of the range.
Report a band rather than a point
Compute at pessimistic, expected and optimistic churn, and quote the pessimistic figure whenever the model is used to justify spending.
Prefer observed cohort survival over a rate
If 14 of your first 20 paying accounts are still active after four months, say exactly that, and refuse to extrapolate past the data you have.
Andreessen Horowitz makes the same warning in its list of 16 startup metrics, where lifetime value is flagged as one of the easiest numbers to inflate through optimistic retention and non-margin-adjusted revenue.
Why the 3:1 rule keeps getting misapplied
The heuristic says a healthy SaaS business earns at least three times its acquisition cost over a customer’s life. It is a reasonable steady-state target for a company with measured retention. Four things break it in practice.
| How the rule breaks | The input founders feed it | What it does to the ratio |
|---|---|---|
| Revenue instead of margin | $39 rather than $32 | ✗ Overstates by more than 20% before any other mistake compounds it |
| Blended instead of paid CAC | A founder-led motion with organic signups | ✗ Flatters, then collapses once growth has to be bought |
| Uncapped horizon | A small churn assumption | ✗ Manufactures an arbitrarily large ratio |
| Timing left out | 30 months to recover acquisition cost | ✗ A 4:1 business runs out of cash while looking excellent on paper |
Bessemer’s long-running analysis of companies scaling to $100 million treats efficiency and payback speed as separate questions from the raw ratio, and that separation is exactly what founders collapse.
A workable rule for a pre-scale product: compute the ratio with margin-adjusted LTV, a 24-month cap, and paid acquisition cost only. At $210 of paid CAC, the band from our churn scenarios lands at 2.2 to 3.7, which is a fair thing to show an investor and a fair thing to act on.
CAC payback is the metric to trust first
Payback period asks how many months of contribution margin it takes to earn back what you spent acquiring the customer. Divide acquisition cost by monthly contribution margin: $210 divided by $32 is 6.6 months. Every input there is measurable inside one quarter, with no retention assumption anywhere in the calculation, which is why it beats LTV as an early decision metric. Klipfolio’s reference on the CAC payback period frames it as a cash-recovery question, and cash recovery is precisely what an under-funded product needs to know.
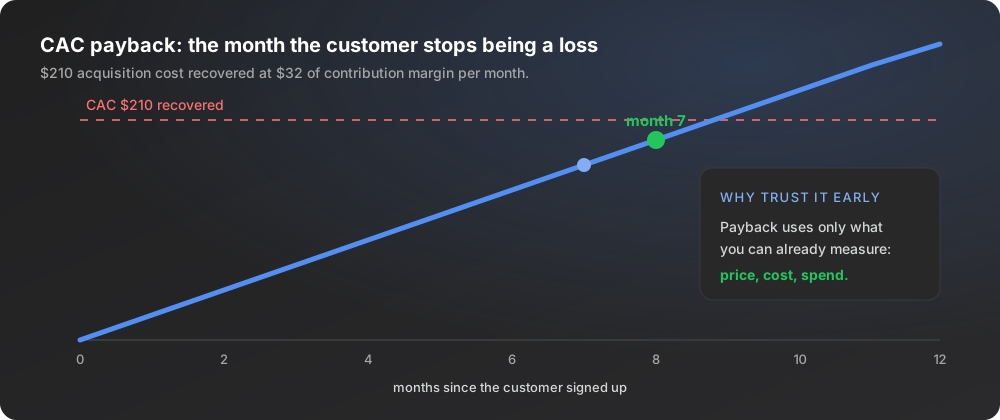
For self-serve developer tools, under 12 months of payback is comfortable and under 6 is strong. The number also converts directly into a runway question: if payback runs at 7 months and your remaining runway is 9, then any customer you acquire this quarter is roughly cash-neutral before the money runs out, and acquiring more of them faster makes the cash position worse before it makes it better.
Modelling when you have almost no data
Fourteen users and three months of history is enough for a real model, provided you are explicit about which numbers are measured and which are assumed. Build it from three measured inputs: the price you can actually charge (see pricing a developer tool for how to arrive at that), the variable cost per account taken from last month’s invoices, and the acquisition spend you have already made divided by the customers it produced. Then add exactly one assumption, retention, and carry it as a range rather than a value.
Write your kill thresholds before you compute, not after.
Set the kill thresholds first
Payback beyond 18 months means the price is wrong or the channel is wrong. Gross margin under 60% means the product architecture is wrong. A pessimistic-case ratio under 1.5 means stop spending. Deciding those in advance keeps the model from becoming a device for justifying whatever you already wanted to do.
One more input is worth measuring before any of this: whether the pain you are charging for is warm or cooling. That is a demand question rather than a finance one, and it is covered in measuring demand for a SaaS idea. Recency is the cheap version of it. On the current EchoSift board, “Missing Rate Limiting in API Endpoints” carries a score of 85.5 across a volume of 84 mentions from 50 distinct owners, sizeable breadth, yet its recent mentions fell from 5 to 3. A large lifetime volume with a cooling recent window is a different investment case from the CI/CD theme that tripled in the same period, and unit economics built on the cooling one will keep degrading no matter how clean the arithmetic looks.
Recompute monthly, cohort by cohort
Unit economics is a maintained model, not a slide. Once a month, recompute contribution margin from the latest invoices, refresh the retention band with one more month of observed cohort data, split payback by acquisition channel so a cheap organic channel stops hiding an expensive paid one, and check gross margin drift as usage grows. The failure mode is silent: costs creep, the model stays frozen in the spreadsheet from launch week, and the business looks profitable per customer for a full quarter after it stopped being so.
EchoSift’s own dataset spans 33,072 signals with 2,635 new ones in the last seven days, which is the volume side of the same story. The founders who make good calls with that data are the ones who convert aggregates into per-unit terms before they decide anything.
This article was drafted with AI assistance and reviewed against EchoSift’s proprietary signal data before publishing.