How to Turn User Feedback Into a Product Roadmap
A repeatable system for converting a pile of raw feedback into a sequenced roadmap: capture in one log, cluster into themes, weight by distinct-owner demand and growth, and close the loop.
 Alessio Persico Founder of EchoSift



Picture a product team handling a week of inbound: a request arrives, it feels urgent, and it jumps the queue because it is the most recent voice in the room. Do that for a quarter and the roadmap becomes a transcript of whoever emailed last, weighted by nothing except volume and mood. A folder full of feature requests stays raw material until you cluster it into themes, weight those themes by evidence, and sequence them into a plan. The job of turning feedback into a roadmap is the job of converting that noisy transcript into a ranked, defensible sequence of what you will build, in what order, and why. This article lays out a system for doing that conversion for a developer tool, end to end.
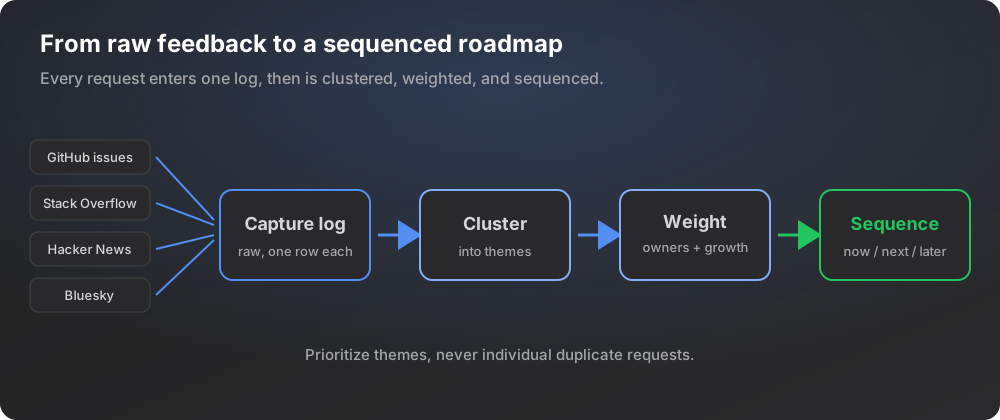
The system has five moving parts.
Capture
One log for everything, whatever inbox it arrived in.
Cluster
Group raw notes into themes, so duplicates stop counting as demand.
Weight
Score each theme by distinct owners, growth, and fit with your thesis.
Sequence
Plot weighted demand against build cost and split into now, next, later.
Close the loop
Tell the people who asked what happened, including the ones you said no to.
None of it is glamorous. All of it is what separates a roadmap you can defend in a room from a wishlist you rearrange every time someone complains loudly. It sits downstream of validating the idea and running early customer discovery, and it never stops once the product is live.
Capture everything in one log first
You cannot prioritize what you cannot see. The first discipline is boring and non-negotiable: every piece of feedback lands in one log, no matter where it arrived. Support tickets, a throwaway line in a Discord thread, a GitHub issue, a sales call note, a churned user’s exit reply.
What a scattered log costs you
If feedback lives in six inboxes, it lives nowhere, and your memory quietly promotes whatever you heard this morning.
One row per piece of feedback, with a few structured fields: who said it, what they were trying to do, the raw quote, and the date. Resist the urge to editorialize in the log itself. The interpretation comes later, and if you bake it in too early you will lose the ability to re-cluster when a pattern you did not expect starts to form.
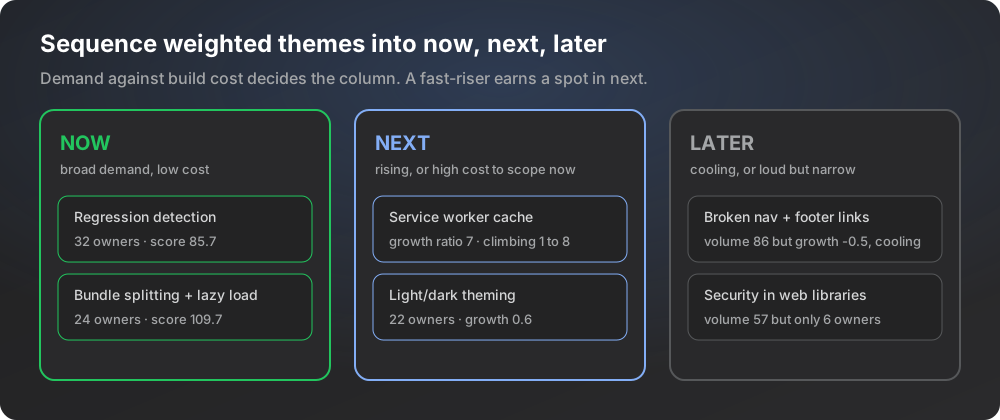
The reason to keep the raw text is that the same underlying pain shows up in wildly different words. One person reports slow page loads, another asks for code splitting, a third files a bug about a heavy bundle. In EchoSift’s own data those all collapse into a single theme, “Improving Performance through Bundle Splitting and Lazy Loading”, which carries a score of 109.7 across a volume of 44 mentions and, crucially, 24 distinct owners. If those 44 mentions had stayed scattered across three differently worded buckets, none of them would have looked big enough to act on. Capture preserves the raw words so the next step can merge them correctly.
Cluster raw notes into themes
Prioritizing individual requests is a trap, because individual requests are duplicates in disguise. The second step is to group the log into themes: distinct problems, each with many pieces of feedback attached. This is the step where you deduplicate the loudest voice. A user who files the same complaint eight times across two weeks is one owner, not eight data points, and a good theme records that distinction explicitly. When you cluster, count two numbers per theme: the total volume of mentions, and the number of independent people, the owners, behind them. Those two numbers rarely agree, and the gap between them is the most useful thing on the board.
Consider “Dependency Management and Documentation Frustrations”, which in the live data reaches a score of 99.4 on a volume of 64 mentions held by 23 owners. That is a broad theme: sixty-plus mentions, but spread across two dozen independent people, which means the pain generalizes beyond any one team’s setup. Contrast that shape with a theme where a large volume hides behind a tiny crowd, and you have the core tension the next step exists to resolve. Clustering is not busywork; it is the act of turning a transcript into a set of candidate roadmap items, each with a demand shape you can actually reason about.
Weight each theme by owners, growth, and fit
Now you rank, and the ranking rule is the whole ballgame. Do not rank by volume. Rank by a small weighted blend of three things: how many distinct owners want the theme, how fast it is growing, and how well it fits the product you are actually trying to build. Distinct owners measure breadth of demand. Growth measures whether the pain is spreading or fading. Fit is your judgment call about whether solving it moves you toward your thesis or drags you sideways into becoming a different product.
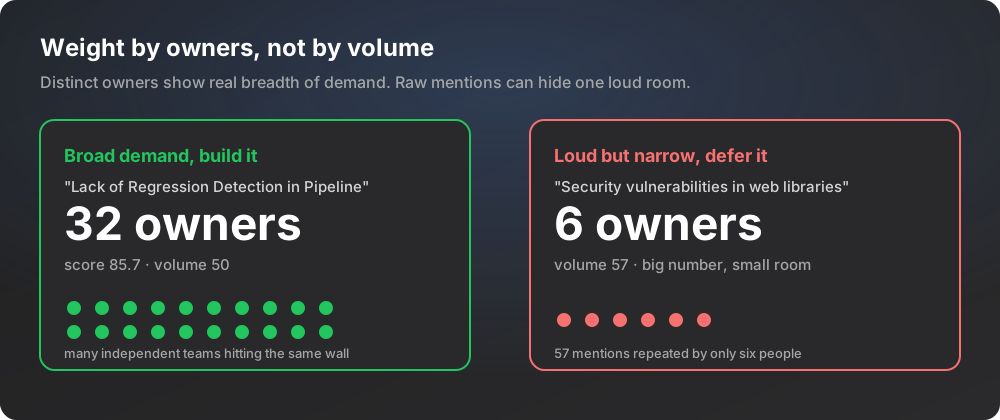
Breadth first. “Lack of Regression Detection in Automated Pipeline” sits at a score of 85.7 across a volume of 50 and is held by 32 owners, one of the widest ownership counts on the board. That breadth is a strong signal: thirty-two independent teams hitting the same wall is a durable problem, not a one-off. Growth second, and growth is where a single snapshot lies to you. “Service Worker Cache Management Issues” carries a growth ratio of 7 because its mentions climbed from 1 to 8 in a single period. At only 10 owners it is small today, but it is climbing fast, and a theme on that trajectory deserves a spot on the “next” list even if its lifetime total is modest. The public frameworks for this, from RICE scoring to the RICE model breakdown at ProductPlan, all encode the same instinct: reach and confidence, not raw request count, decide the order.
Separate the signal from the loudest voice
The single most expensive prioritization mistake is mistaking volume for demand. A theme can be loud because many people feel it, or loud because a few people say it constantly. Those look identical on a bar chart of mention counts and could not be more different on a roadmap. This is why the owners column exists.
Three themes from the live data show the two traps and the shape you actually want.
| Theme in the live data | The numbers behind it | Reads as |
|---|---|---|
| Security vulnerabilities in web libraries | 57 mentions from just 6 owners | ✗ Loud but narrow, a small motivated room |
| Broken Navigation and Footer Links | 86 mentions, 38 owners, growth ratio -0.5 | ~ Broad but cooling, recent mentions fell from 4 to 2 |
| Inconsistent theming in light/dark mode | score 86.9, 22 owners, growth ratio 0.6 | ✓ Broad enough to matter, still warm |
Building your quarter around the first means serving six accounts while thirty-two teams wait on regression detection. The second looks like an obvious top priority until the trajectory is read, and cooling themes belong lower than their raw size suggests. Read owners to catch the loud-but-narrow trap, and read growth to catch the large-but-fading one.
Sequence into now, next, and later
Scores rank themes, but a ranked list is not yet a roadmap. The last analytical step is to plot each weighted theme against a rough estimate of build cost and sort the result into three buckets: now, next, and later. A high-demand, low-cost theme is an obvious now. A high-demand, high-cost theme is a next that you start scoping today so it does not get perpetually outranked by cheap, shallow wins. A low-demand theme, however loud its origin, is a later, and saying so out loud protects you from rebuilding your plan around the last angry email.
Keep the now bucket small enough to actually finish, and keep it matched to the capacity you really have. The purpose of the three buckets is not precision; it is to make trade-offs visible so that a strong-but-expensive item is chosen against, not merely forgotten. Marty Cagan’s argument for outcome-based roadmaps at SVPG is the useful discipline here: a roadmap is a set of problems you have decided to solve in order, not a list of dated feature promises you will be judged against. Order the problems by evidence, commit to the top of the list, and leave the tail explicitly deferred rather than silently ignored.
Close the loop with the people who asked
The step almost everyone skips is the one that compounds. Once a theme moves onto the roadmap, or off it, tell the people who raised it. A short note that says “we are building this, here is roughly when” turns a requester into an advocate. A harder but more valuable note says “we are not building this, and here is the reason”, which respects the person enough to give them the reasoning and quietly teaches them what your product is for. Silence does the opposite: it trains users that feedback disappears into a void, and they stop giving it, which starves the whole system at the source.
Closing the loop is also how you keep your reads calibrated. When you ship against a theme and the underlying complaints keep climbing, your fix missed. When they fall, you were right. That before-and-after is the same evidence you used to sequence the roadmap in the first place, now pointed backward as a scorecard. This is exactly the loop that produces durable signals of product-market fit: a problem you chose on evidence, shipped against, and watched recede.
The manual method, at scale
Done by hand, this system is a spreadsheet, a lot of tab-switching, and the constant risk that a theme forming across GitHub and Stack Overflow at the same time never gets clustered because the two feeds live in different windows. That is the exact work EchoSift automates. It ingests complaints across 4 sources, clusters them into themes with owner and growth counts already attached, and ranks the result the way this article describes.
Each theme arrives carrying the distinct-owner and trajectory numbers that turn a pile of feedback into an ordered plan. The method above is the method; the tool is what lets you run it continuously instead of once a quarter when the backlog finally overflows.
This article was drafted with AI assistance and reviewed against EchoSift’s proprietary signal data before publishing.